
![]()
![]()
![]()
![]()
![]()
![]()
![]()
![]()
![]()
![]()
![]()
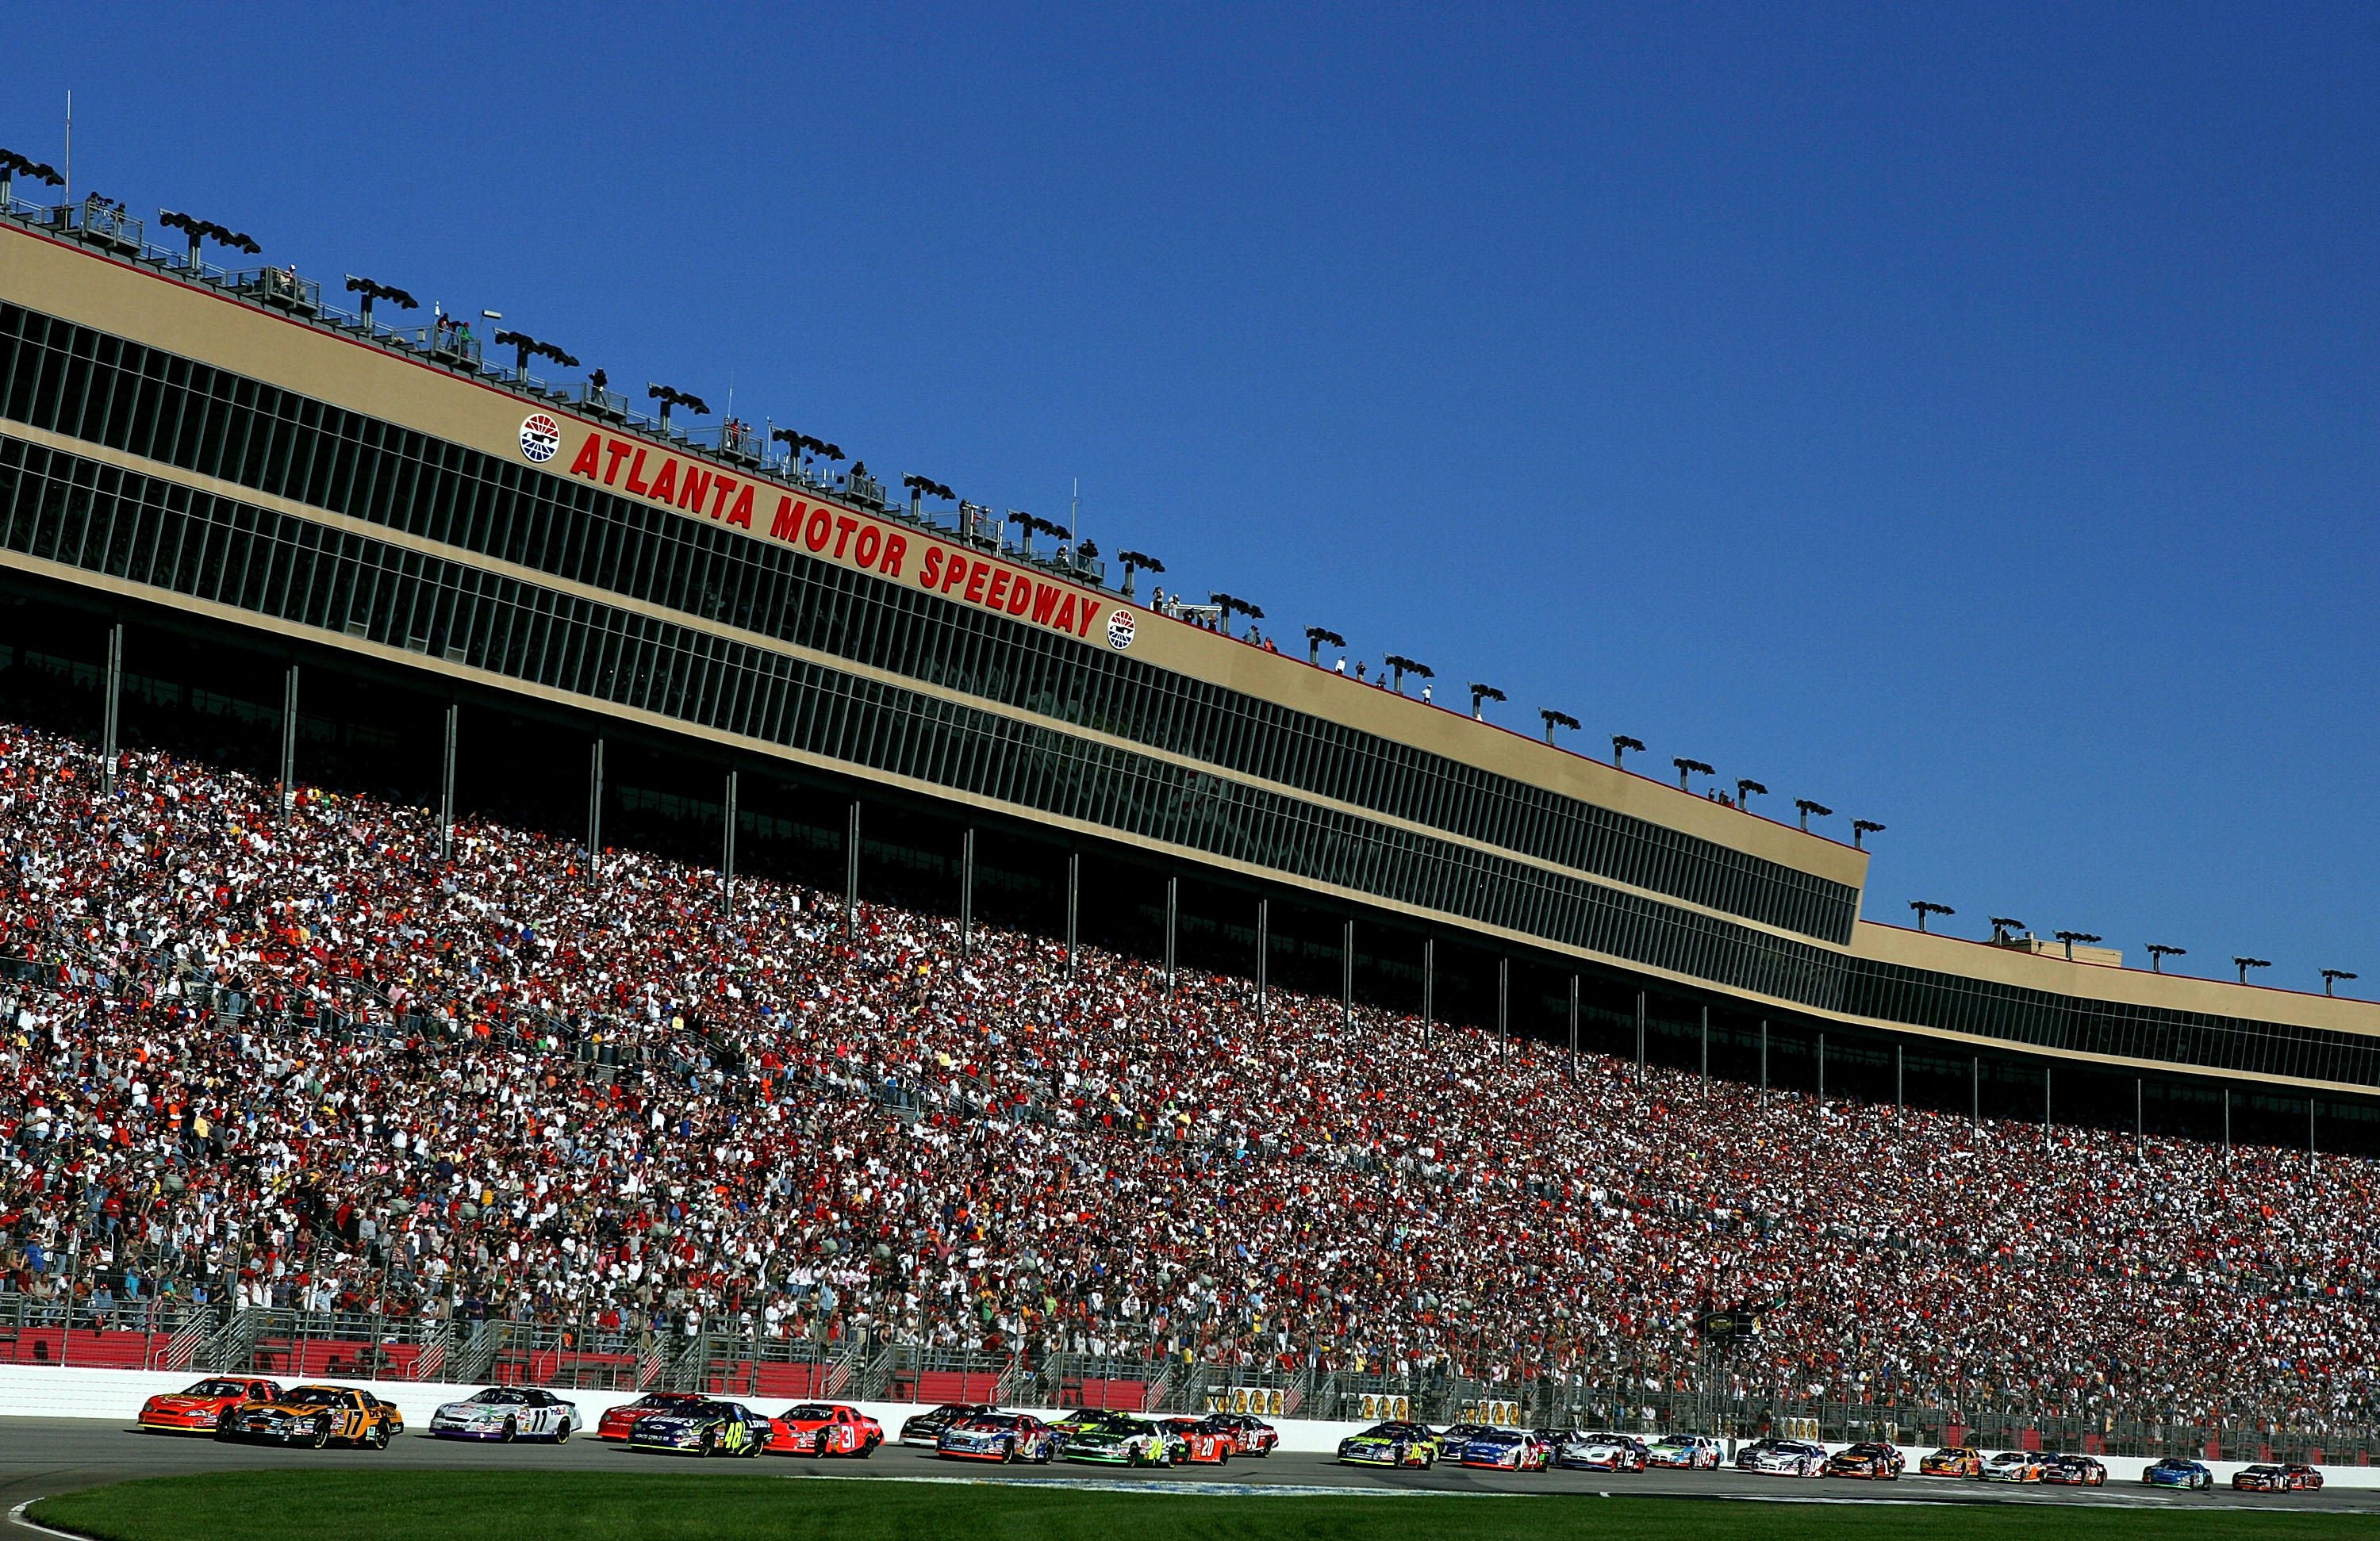
Matt Kenseth leads the field to the green-flag at Atlanta Motor
Speedway. (Photo Credit: Darrell Ingham/Getty Images for NASCAR)
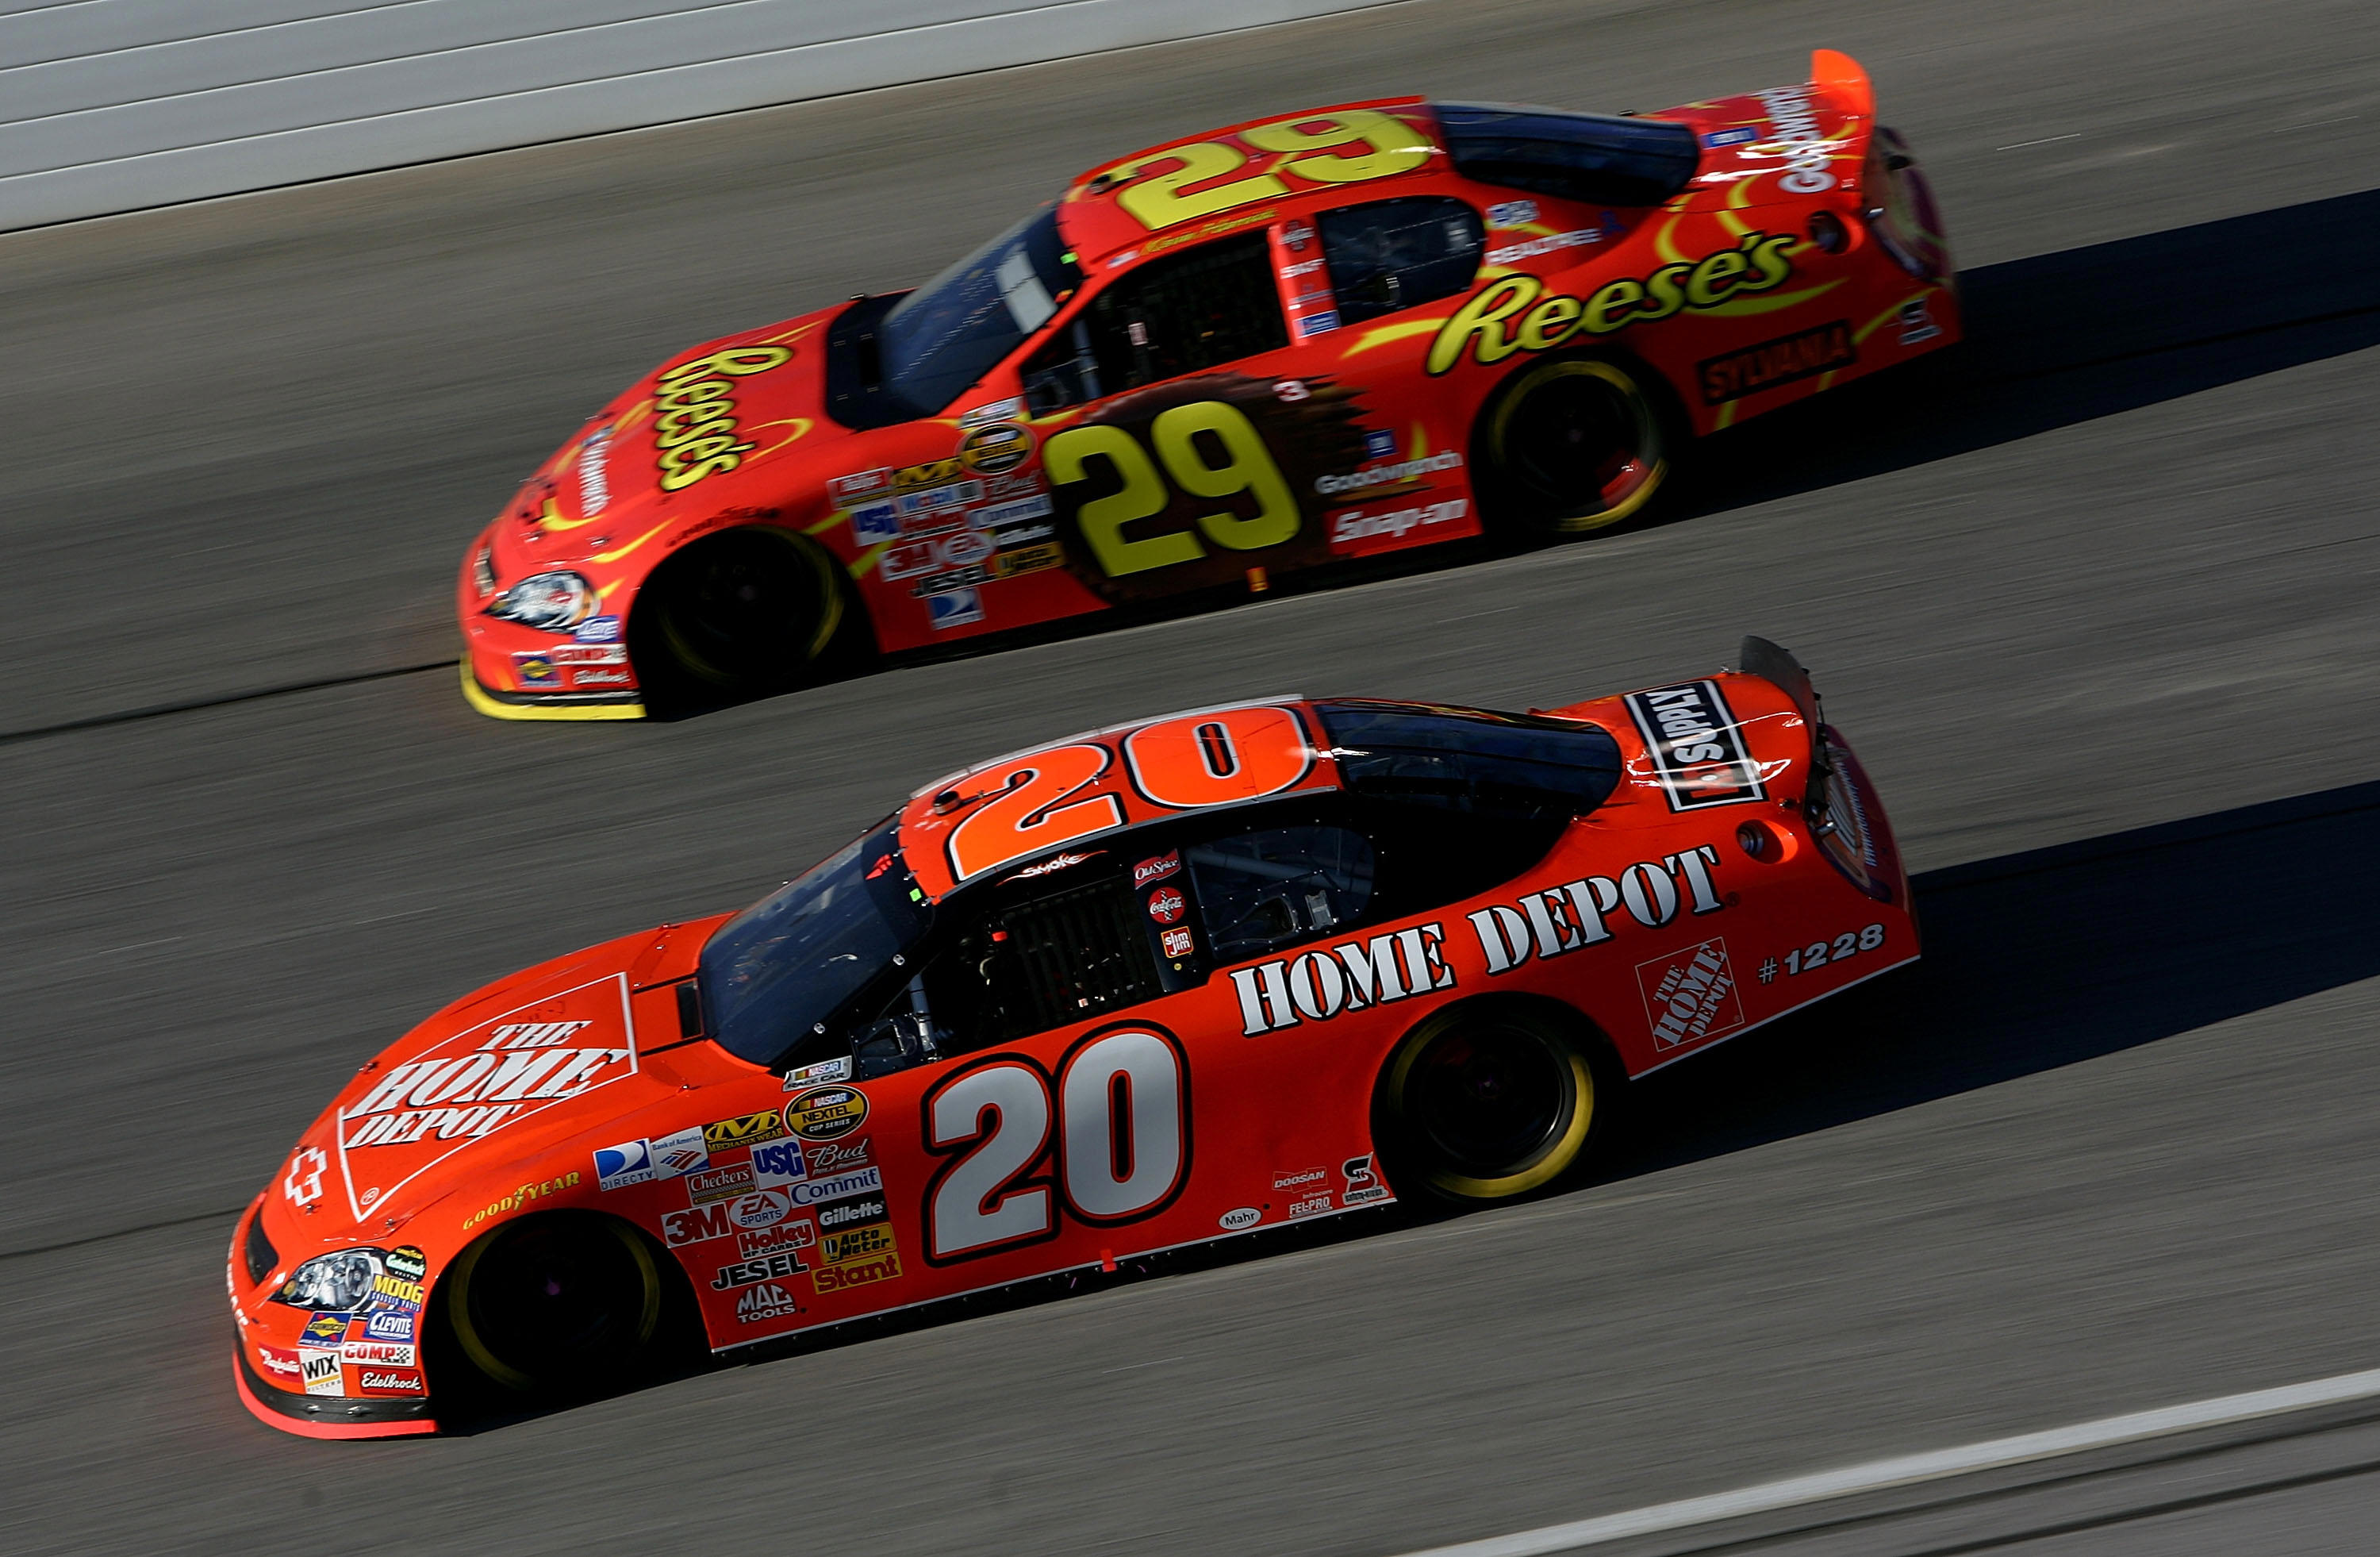
Tony Stewart races side-by-side with Kevin Harvick at Atlanta Motor
Speedway. (Photo Credit: Darrell Ingham/Getty Images for NASCAR)
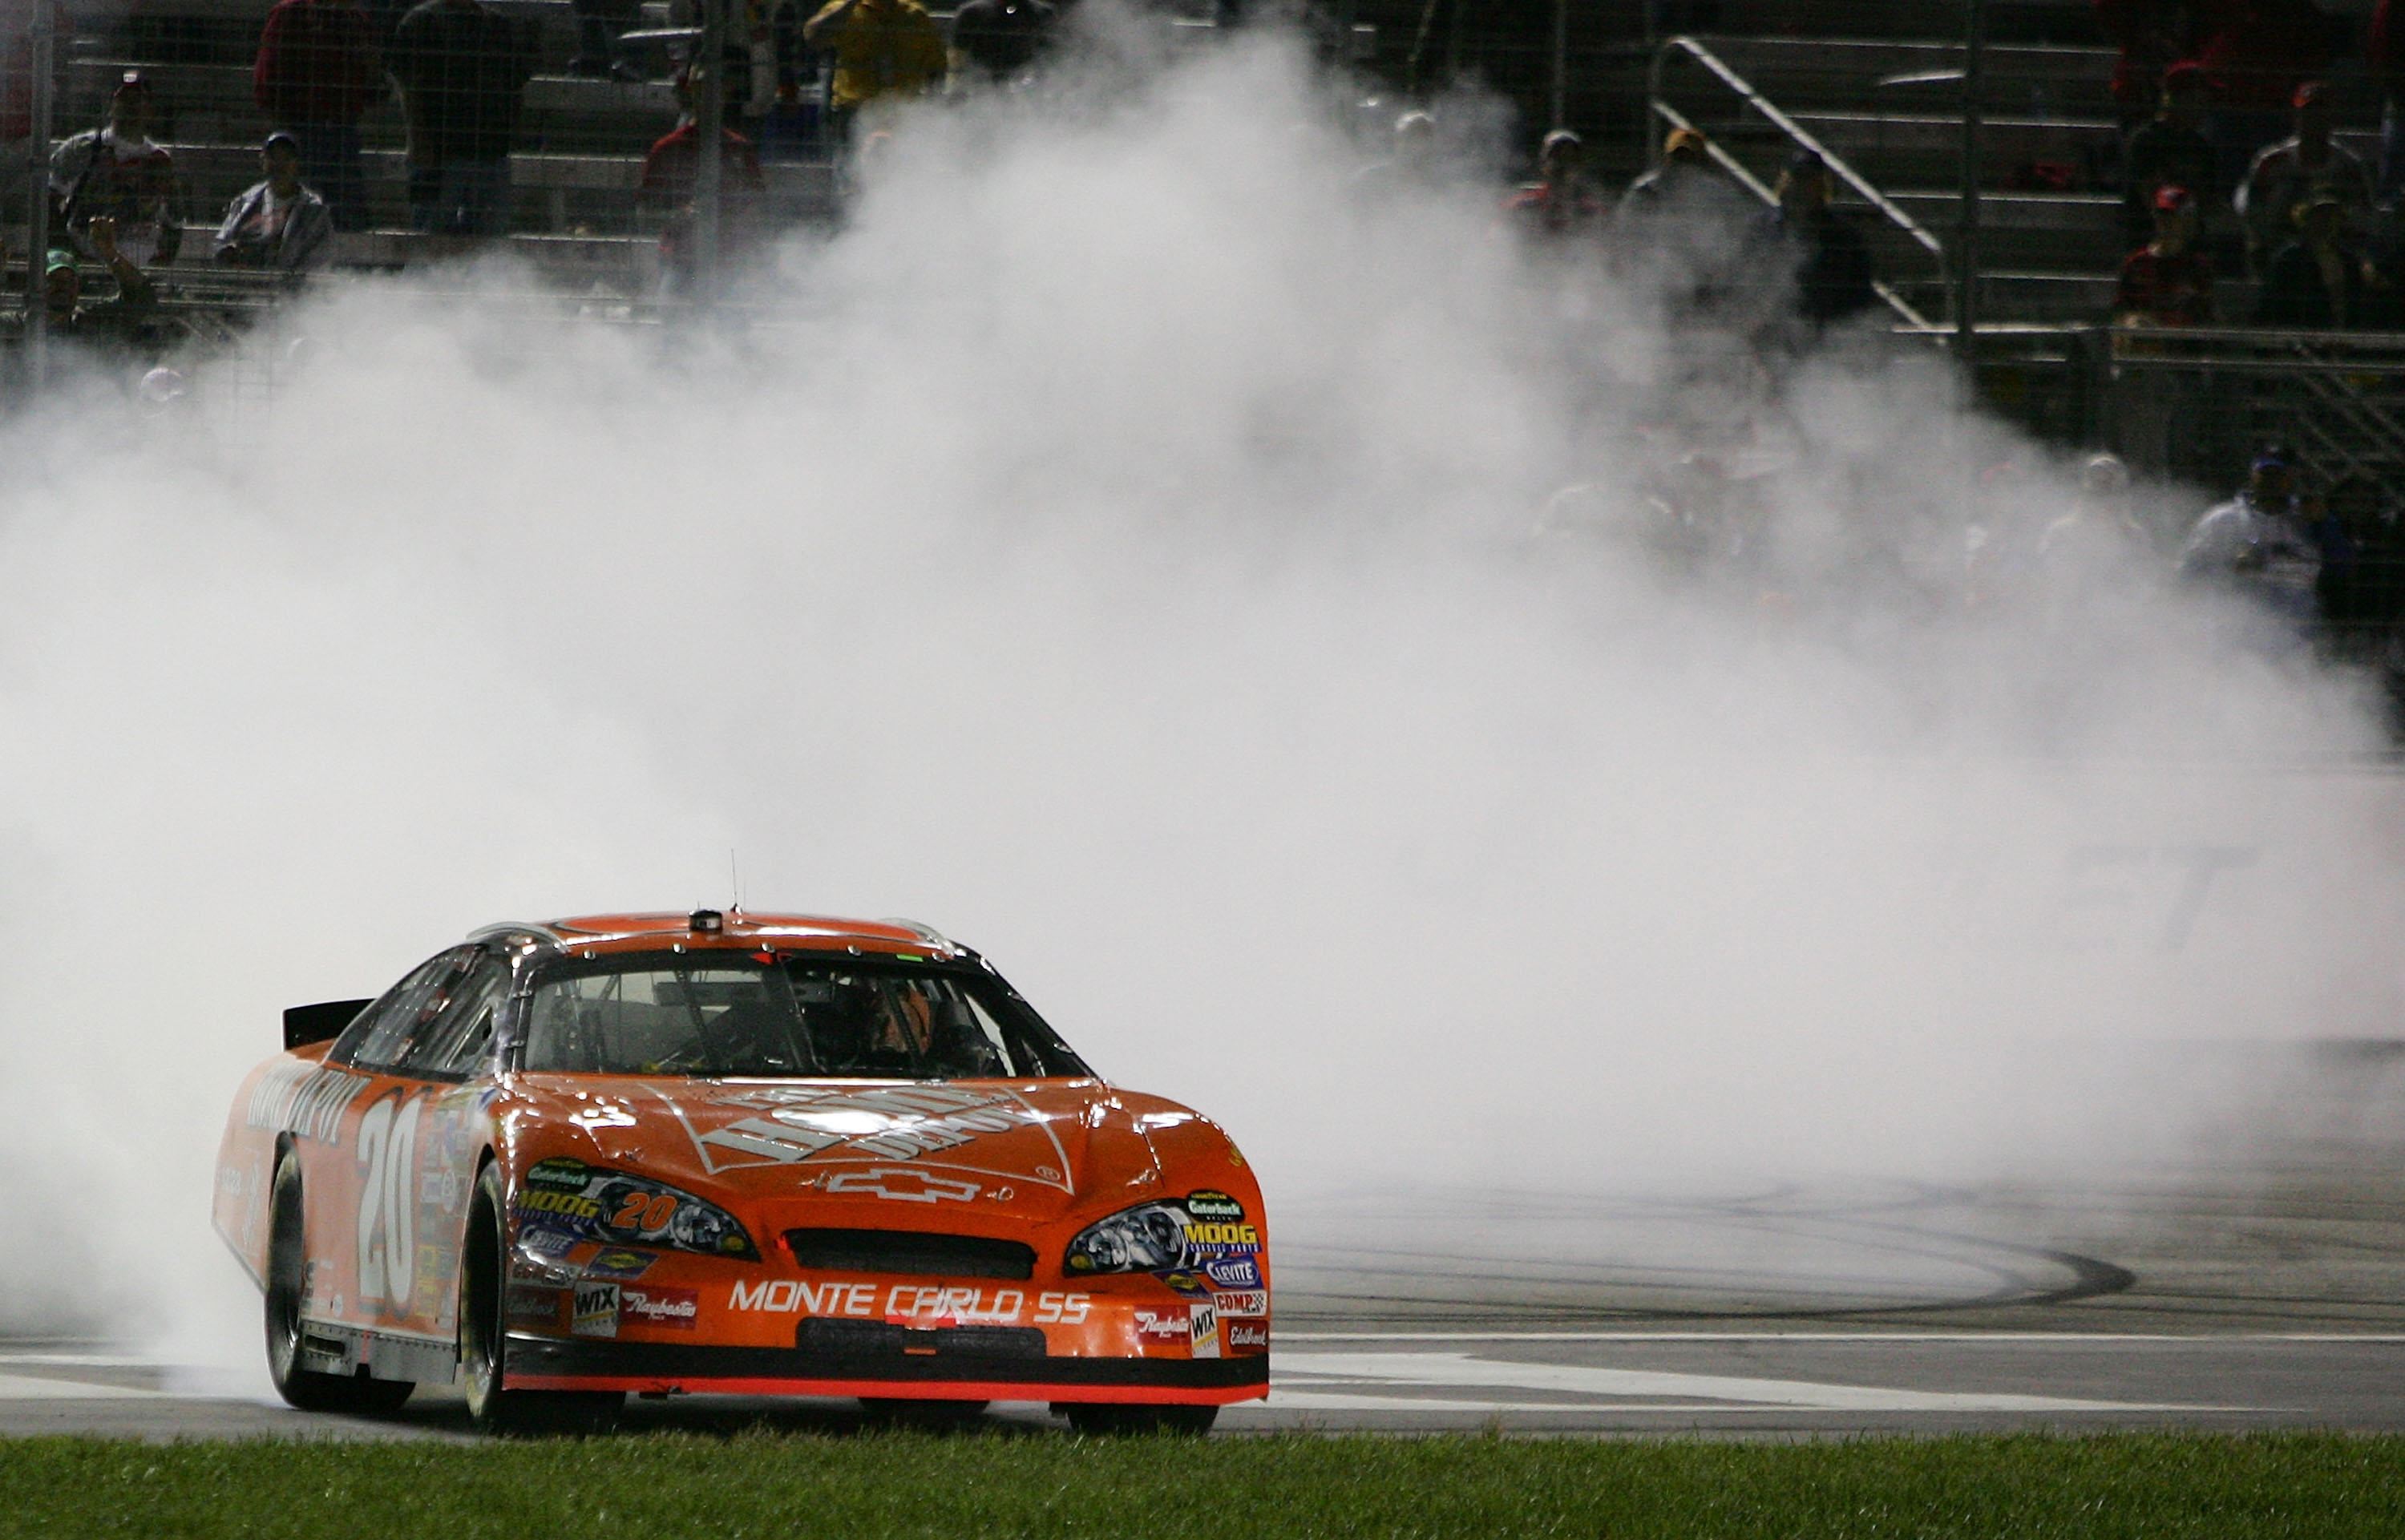
Tony Stewart celebrates after winning the Bass Pro Shops 500. (Photo
Credit: Darrell Ingham/Getty Images for NASCAR)
JOHNSON CLOSING IN ON KENSETH AFTER STRONG ATLANTA RUN
* Hamlin a Strong Finisher While Earnhardt and Gordon Struggle
 DAYTONA
BEACH, Fla. (Oct. 30, 2006) –
Matt Kenseth managed to keep his lead in the Chase for the NASCAR NEXTEL
Cup after finishing fourth Sunday at Atlanta Motor Speedway.
DAYTONA
BEACH, Fla. (Oct. 30, 2006) –
Matt Kenseth managed to keep his lead in the Chase for the NASCAR NEXTEL
Cup after finishing fourth Sunday at Atlanta Motor Speedway.
Jimmie Johnson, who struggled early in the Chase, falling as far as eighth place and 165 points behind the leader, now ranks second, only 26 behind Kenseth after a strong runner-up performance at Atlanta.
It’s hard to argue that Johnson has been the best driver in the Chase. He holds the top Chase-specific Driver Rating of 106.9 and has the best Average Starting Position of 7.6.
Additionally, Johnson has led the most laps during the Chase (19.7%). He also has consistently been in the top 15, completing 83.3% of his Laps in the Top 15. Johnson also is one of the fastest drivers, running the Fastest Lap 11.7% of the time.
Denny Hamlin currently ranks third in the series standings partially due to his ability to head to the front of the field late in a race. He gains an average of four positions from mid-race to the finish, going from 17th to a finish of 13th place.
Conversely, Dale Earnhardt Jr., and Jeff Gordon have struggled during the second half of the Chase races. Although Earnhardt has the second-best Chase Driver Rating (105.4), he loses nearly six positions from mid-race to finish, falling from eighth at mid-race to finish 14th. Gordon loses nearly 12 positions, going from fifth at mid-race to a finish of 17th.
Driver Rating Continues to Predict Strong Finishes…
Tony Stewart came into Atlanta with the seventh-best pre-race Driver Rating and left with the Bass Pro Shops 500 trophy.
Greg Biffle had the top pre-race Driver Rating coming into Atlanta and finished fifth. Here are some statistics on the accuracy of Driver Rating when using it to predict a driver’s finish:
Race winner:
· The race winner has had a pre-race Driver Rating ranking in the top four in 13 of the 33 races.
· The race winner has had a pre-race Driver Rating ranking in the top 10 in 19 of the 33 races.
· The race winner has had a pre-race Driver Rating ranking in the top 12 in 25 of the 33 races.
Top rated pre-race driver:
· The driver with the top pre-race Driver Rating has won seven times in the first 33 races.
· The driver with the top pre-race Driver Rating has finished in the top five in 20 of the 33 races.
· The driver with the top pre-race Driver Rating has finished in the top seven in 23 of the 33 races.
IN THE LOOP – NASCAR LOOP DATA STATISTICAL ANALYSIS POST-ATLANTA
Loop Data Analysis from STATS LLC:
From Stefan Kretschmann of STATS LLC (the company that compiles NASCAR’s Loop Data):
“Matt Kenseth continues to lead the Chase for the NASCAR NEXTEL Cup and finds a familiar face in Jimmie Johnson running second, just 26 points behind. Kenseth and Johnson have the highest Driver Rating for the entire year (103.1 and 100.8 respectively). They have scored the most points among Chase drivers during the Chase (958 for Kenseth and 937 for Johnson), though they trail both Carl Edwards (1002) and Tony Stewart (995) in points among all the drivers.
“Johnson has the best Driver Rating (106.9) during the Chase, followed closely by Dale Earnhardt Jr. (105.4) and Jeff Gordon (103.5). Earnhardt’s title hopes have been hampered by late-race trouble, which is reflected in his average mid-race position of 7.6 and his average finish of 13.7. Gordon has had similar troubles, sporting an average mid-race portion of 4.9, before falling to an average finish of 16.6. Earnhardt (8.333) and Gordon (9.152) are the only drivers who have kept their Average Running Position inside the top ten during the Chase.”
Loop Logic …
· The average top Driver Rating for 2006 is 128.5. The average finish for the top rated pre-race driver is 12.182.
· The average Driver Rating of the winning driver in 2006 is 98.3. The average pre-race Driver Rating rank for the winning driver is 9.250.
|
Fastest Laps Run |
|
Laps in Top 15 |
|
Average Running Position |
|||
|
Driver |
Fastest Laps |
|
Driver |
Laps |
|
Driver |
Average Place |
|
Kasey Kahne |
619 |
|
Jeff Gordon |
7,616 |
|
Jeff Gordon |
10.784 |
|
Greg Biffle |
579 |
|
Matt Kenseth |
7,529 |
|
Matt Kenseth |
11.147 |
|
Tony Stewart |
513 |
|
Jeff Burton |
7,279 |
|
Jimmie Johnson |
11.188 |
|
Jeff Gordon |
485 |
|
Jimmie Johnson |
7,069 |
|
Jeff Burton |
11.801 |
|
Dale Earnhardt Jr. |
485 |
|
Dale Earnhardt Jr. |
7,040 |
|
Dale Earnhardt Jr. |
12.783 |
|
|
|
|
|
|
|
|
|
|
Closers |
|
Mile Leaders |
|
Quality Passes |
|||
|
Driver |
Positions Gained |
|
Driver |
Miles Led |
|
Driver |
Passes |
|
Tony Raines |
51 |
|
Matt Kenseth |
1,429.73 |
|
Jimmie Johnson |
1,843 |
|
Ken Schrader |
50 |
|
Greg Biffle |
1,337.41 |
|
Jeff Burton |
1,826 |
|
Dale Jarrett |
44 |
|
Tony Stewart |
1,245.10 |
|
Dale Earnhardt Jr. |
1,805 |
|
Bill Elliott |
42 |
|
Kasey Kahne |
1,060.28 |
|
Kurt Busch |
1,767 |
|
Travis Kvapil |
40 |
|
Jeff Gordon |
982.65 |
|
Carl Edwards |
1,763 |
IN THE LOOP – NASCAR LOOP DATA STATISTICAL ANALYSIS POST- ATLANTA
NASCAR Loop Data Statistics – Glossary & Definitions
Average Running Position – Sum of driver position on each lap, divided by the laps run in the race.
Box Score – Key statistics that summarize a driver’s race performance.
Closers – The number of positions a driver improves over the last 10 percent of the race.
Consecutive Laps With A Pass – Number of consecutive laps with at least one pass.
Consecutive Passes Without Being Passed – Number of consecutive passes without being passed.
Fastest Drivers By Straightaway – Ranks each driver by average speed on each straightaway.
Fastest Drivers By Turn – Ranks each driver by average speed in each turn.
Fastest Drivers Early In Run – Ranks each driver during the first 25% of laps run in a typical full green-flag segment.
Fastest Drivers Late In Run – Ranks each driver during the final 25% of laps run in a typical full green-flag segment.
Fastest Laps Run – Number of laps that the driver had the fastest car on the track for that lap.
Fastest On Restarts – Shows average speed on the first two laps under green-flag conditions.
Laps Driver Improved Position – The total number of laps where a driver improved his position during a race.
Passing Breakdowns – For each driver, shows how many and what percentage of passes were made by each turn and each straightaway, including the total number of passes.
Quality Passes – Number of times a driver passes another car running in the top 15 under green-flag conditions.
Speed In Traffic – The speed when there is another vehicle within one car length under green-flag conditions.
Time Trailing At Finish – The time that each driver finished behind the race winner. Average green-flag lap time is used to calculate cumulative time for drivers not on the lead lap.
Top 5 Drivers Performance Graph – Graphic showing the progressive performance of the top-five finishers at different intervals throughout the race.